By this point we have all we need for a basic charge, and I do actually need to charge some batteries. I can build a simple current regulator with an LM317 and a resistor, which will be good enough for now.
No Termination
The simplest thing would be just to charge some batteries and log to the computer. There’s a marvellous thing out there called FeedGnuPlot which makes graphing realtime or static data so easy one has to resist the temptation to graph everything. But before we can do that, we need to be able to read analogue values and throw them over USB.
Code
The Pic has a lot of ADC inputs, and Pinguino supports using all of PortA as analogue input. The code is incredibly simple:
 #define batteryIn 0
 unsigned int raw_adc;
 raw_adc = analogueRead(batteryIn);
But because ADCs can jitter a bit, I generally take an average. I should really work out if this is worth it, particularly as the PIC can’t do floating point (more on that later):
unsigned int total = 0;
unsigned int i;
void get_voltage(){
	total = 0;
	for (i=0; i<10; i++) {
		total += analogRead(0);
		}
	raw_adc = total / 10;
	return;
	}
the preprocessor+compiler+goodness knows what else here has problems with sensible things like declaring i in the for loop, so there we go. The default behaviour of division on the PIC with integers is to truncate, which isn’t great, so we define:
unsigned int round_closest(unsigned int dividend, unsigned int divisor) {
	return (dividend + (divisor / 2)) / divisor;
	}
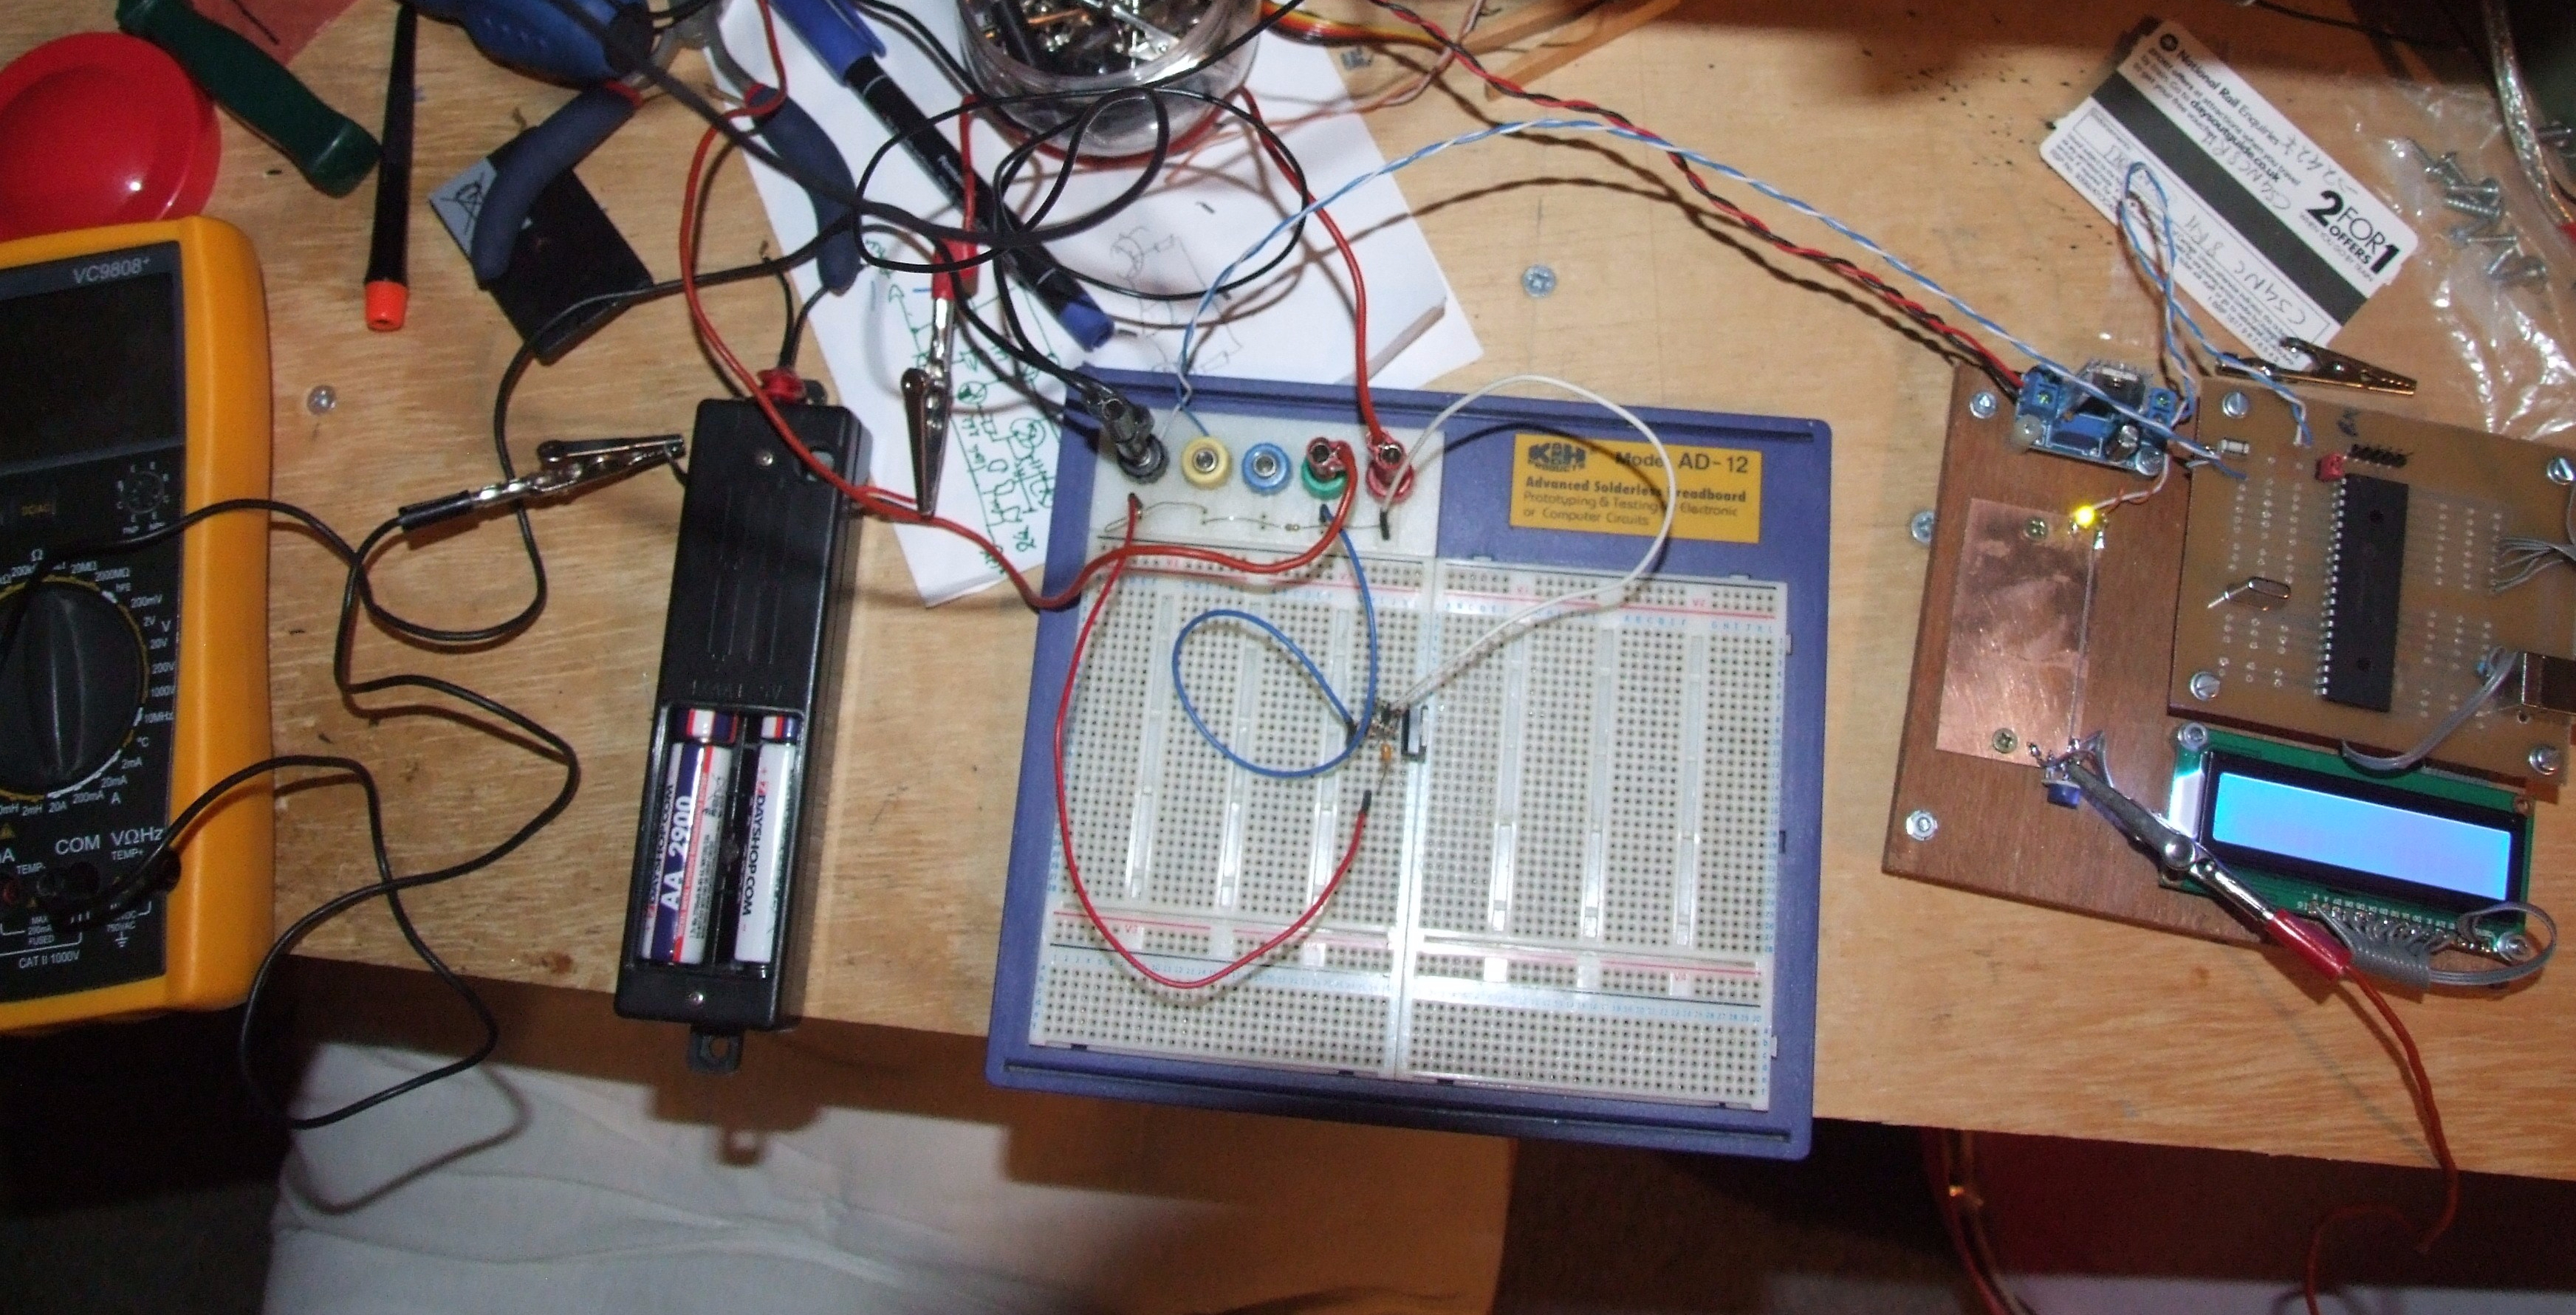
Which came, I think, from StackExchange, but is pretty simple to understand. Now we just need to print the logged values over USB. One would think that the inbuilt CDC (Usb Serial) library would be ideal, but unfortunately it won’t compile… The Pinguino IDE .deb from the main website depends upon something—I forget what—which there is no longer a debian package for, but which installs fine via pip. So I went looking for the ide source, and found that the official GitHub repository only has v11, but the downloaded debs (which include the libraries) are v12 (!). At some point I should unpack the .deb, edit out the dependency, and re-install; for now I’m using v11 with the kludge of pointing it at the v12 libraries. Hopefully that’s why it doesn’t work, as CDC would be nice—it greatly simplifies reading from the computer. I was stumped, and then found the inbuilt ‘BULK’ USB mode. I don’t know enough about USB to know what it’s doing (other than not emulating a serial port), but the library comes with a simple Python script to read a string sent with BULK.printf(). That gives us everything we need for a first basic test. Here’s the rather hasty mock-up. Note the potential divider feeding the ADC to protect it from the full voltage.
Unfortunately I deleted the log, so I can’t screenshot gnuplot, but here’s a screenshot from the code I wrote to play with termination conditions. In reality the curve continues to the right and starts climbing again, which is when we’re into overcharge, but I truncated the data.
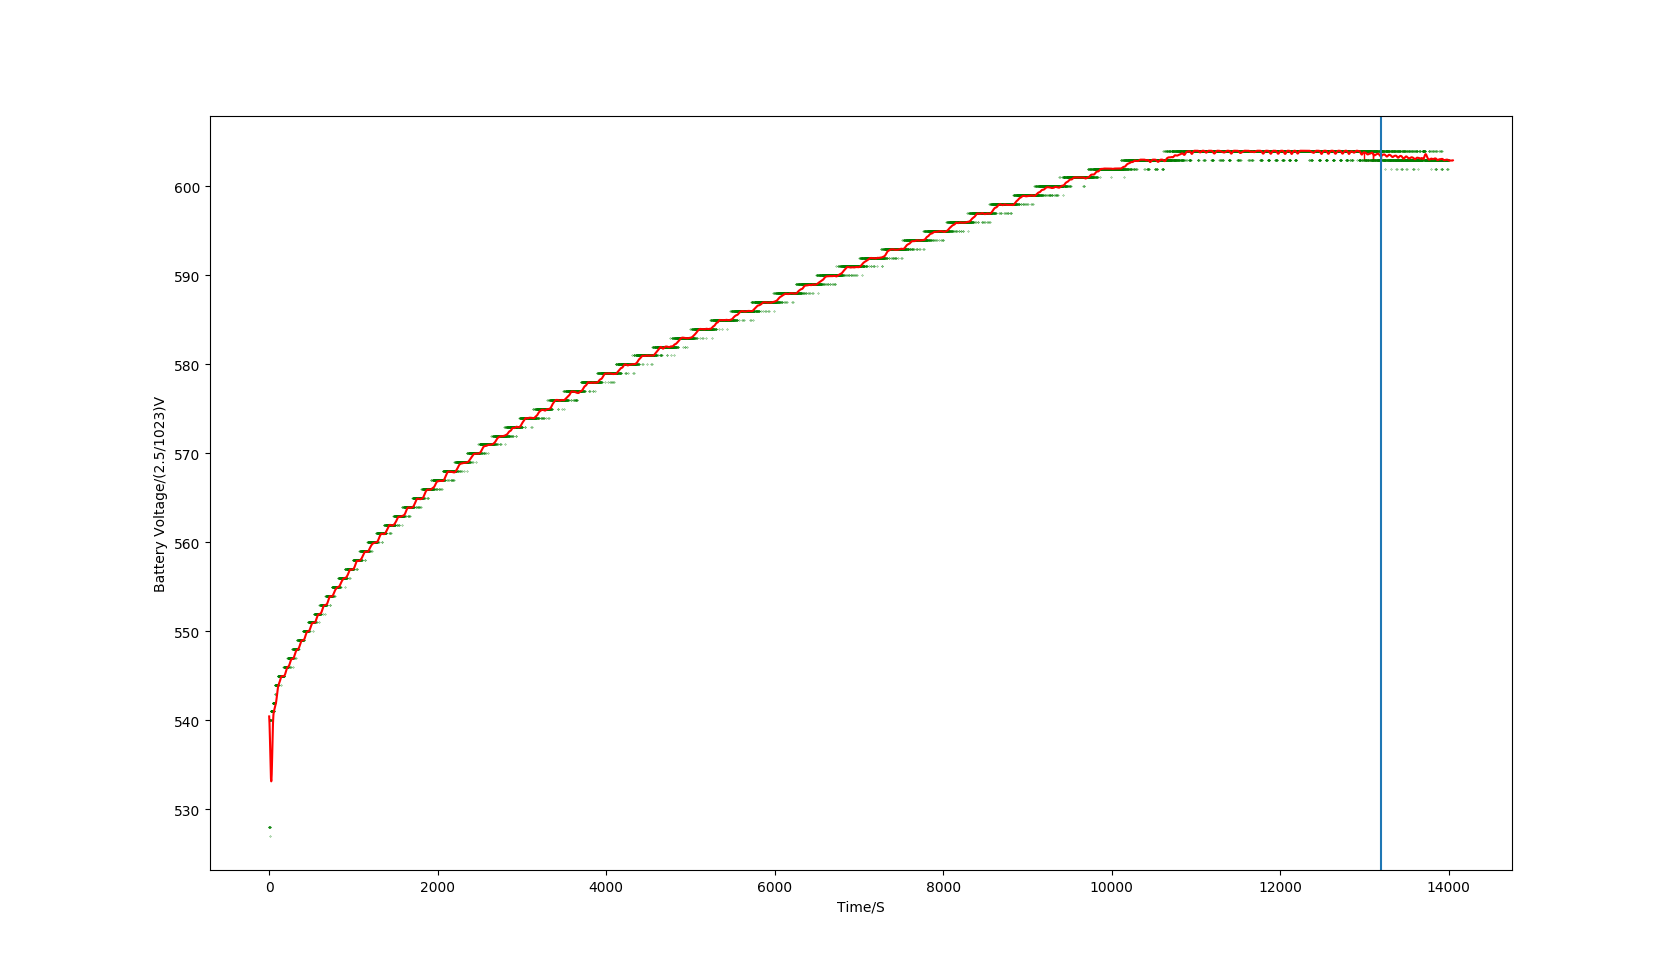
Clearly, it works. Now to get it to work out when to stop charging.